This post is one in a series for a MOOC. You can find similar posts searching under the Category MOOC or searching for hashtag #eteacherTOOL for more about this particular MOOC.
Each Learning Management System (LMS) is expected to have many of the same features, yet have distinctions of the manner in which data is presented. Closer scrutiny might be required, and would be present if this were my actual classroom(s). Additionally consider that many teachers only use an LMS as an additional component to their face-to-face instruction. This is important in that they would not have a reason to rely completely on these tools as these tools would only be measuring the fraction of their content/discussions they decide to put online. There is no right or wrong amount for a blended learning teacher to present on an LMS. I mention these things just to point out unless a teacher is already teacher just online this assignment is challenging.
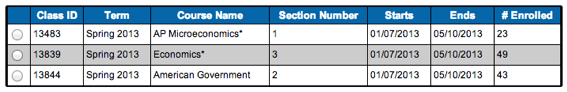
This chart lets the teacher know which classes have the higher number of students. This is necessary for considering class discussion prompts and instructor interactions needed to keep the discussion going. This can also be used in planning the amount of time each class might take for instruction and monitoring in comparison to the others.
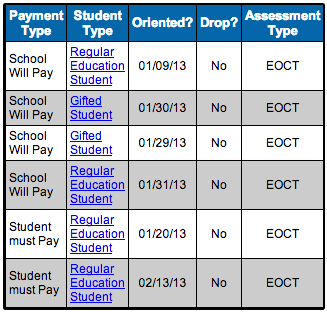
This chart might assist the instructor in establishing the frame of mind of the student, if money is a factor in his/her education. If the end of course test is required might also impact the motivation, stress level of the student as well. If exceptional services are required for students the instructor will need to consider that as well.
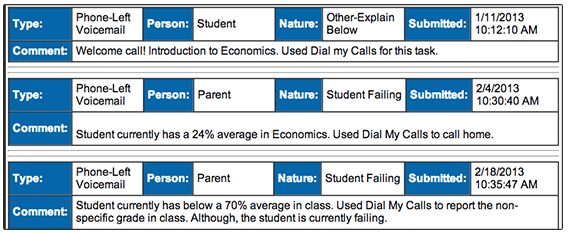
Teachers can find patterns in communication logs which might inform the instructor in brainstorming possible interventions if communications with the home partner educator are not effective.
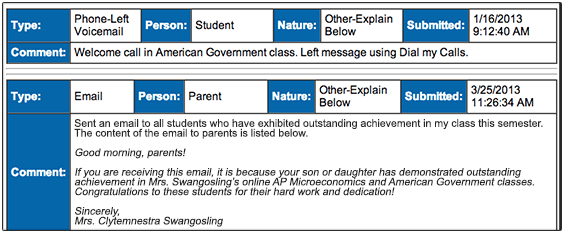
It would be nice if the “good” calls home were in person. They would be easy on the instructor and result in such goodwill.
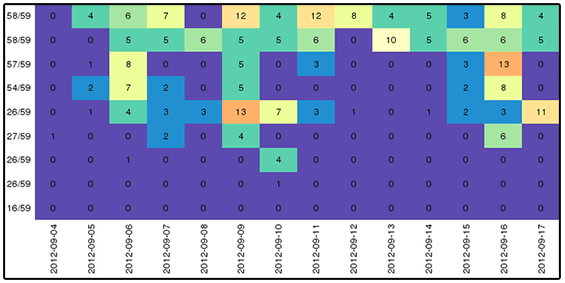
This is the most interesting chart to someone who has not yet taught an online class. This is not a tool a teacher practicing blended learning would be able to utilize as our students would combine online and face-to-face in differing amounts and the numbers would not be consistent with time on task. I would expect students experiencing success in this to be found along the top row. And if those students in the top row also have a high number I might consider them either very hard workers or highly engaged. The more interesting students are those with the orange/yellow numbers of 13, 13, and 11, but down in the 3rd and 5th rows. They are spending time, but not accomplishing as much as some of their other peers.
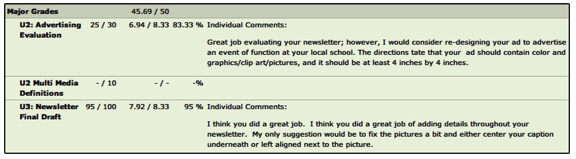
This information should be familiar to any teacher as a grade book user. This speaks to the averaged performance on grade activities.
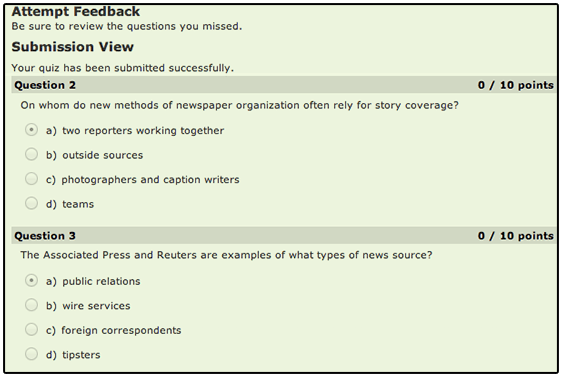
Any online assessment should provide feedback per question once answered; there is no reason to ever turn that feature off.
With tools like this, that all learning activities flow through as in an online class, the teacher should know that the student is in trouble before the student even realizes it.

Leave a Reply