
I have a love affair with every good infographic I see. It can’t just be me, don’t you love it when you “see” the idea before someone makes you read the idea? That kind of double-enforced messaged, confirming what your audience thought all along – brilliant!
Of course, the trick is creating one yourself, right? I’d like to help you along as far as I have traveled down this path.
The tools I have used which I really like are Easel.ly and Canva. I have added LucidPress (12/2019) as another resource for you!
Check out my Evolution in Infographic Skills over Time (2015+)
Here are a couple I have done with Easel.ly, I made this first one for a #MOOC I was taking at the time.

easel.ly
And this second one was for a more recent #MOOC and I am proud to say it has made it on Jerry Blumengarten’s (@Cybraryman1) Educational Web Sites on Netiquette.

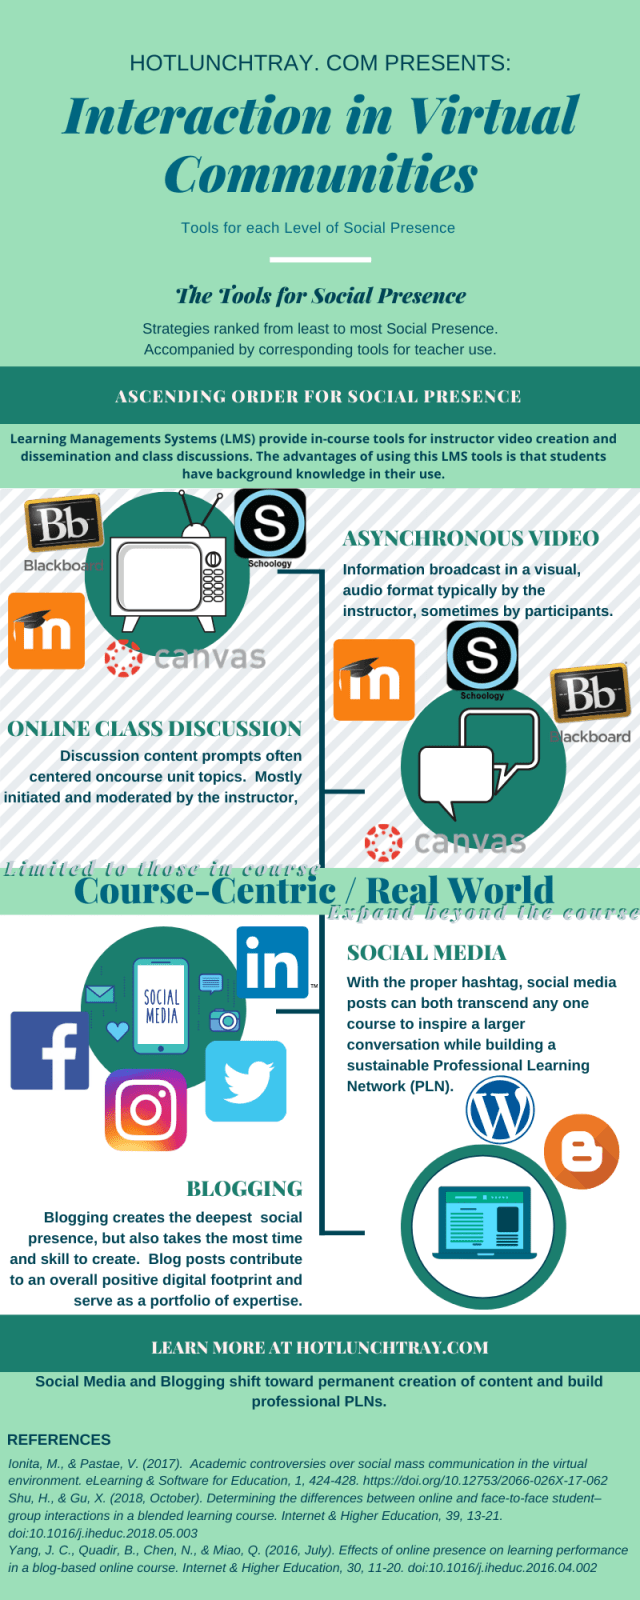
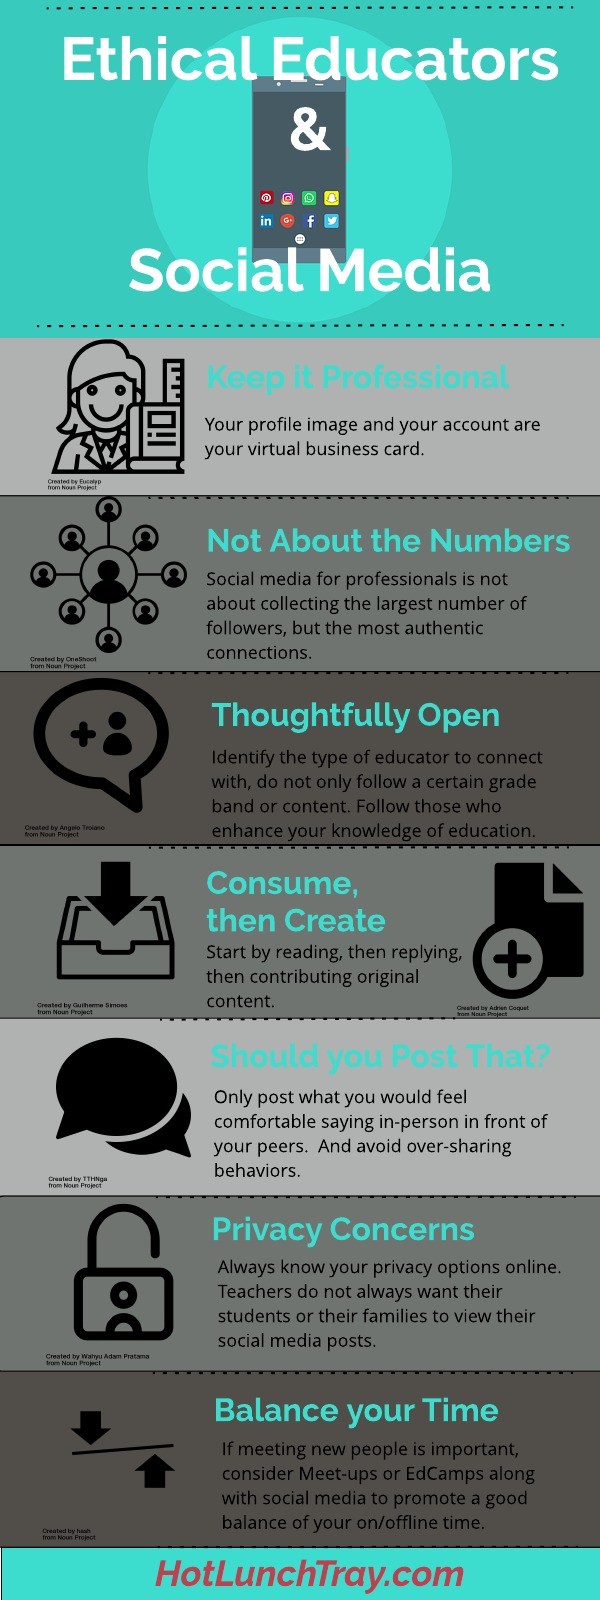
This one, made in Canva, I something I made for a graduate course. I had more requirements than the room, but it illustrates what you can do in Canva for infographics:
We recently added LucidPress and LucidChart to our digital subscriptions based on an awesome integration with our learning management (LMS) Canvas.
I have been a long-time user of Easel.ly. As in when they only offered a half-dozen templates and as in they reset my account at one point, ouch. However, they appear to have overcome those growing pains now and offer enough variety in the templates that it should serve most of your needs without being obviously one of their products. I like their output options, which includes embed code.
Canva has fresher graphics, but did take me a little longer to get the gist of – I still think it has more longevity mostly because it is a multi-purpose tool. Canva will eventually cost me money once I use all of the free graphics and I can see how it would get expensive a la carte at $1 per graphic.
LucidPress is promising but has a steeper learning curve. I will keep working at this one because I think it has more potential than Canvas in the long run.
I also like the dimensions of my more recent creations. For your information, in Canva I use infographics, Pinterest Pins, and Tumblr Posts as my formats.
I think it is safe to say I am getting better at infographics!
My fourth one is cleaner, fewer words, and easier to understand. I think I am “getting there.” Then I will definitely start sharing mine. One way to share your infographics with the world is to publish them to Submit education infographics at eLearning Feeds. Feel free to share ones you already have that show growth like mine – I would love to swap stories with anyone learning.


1 Pingback