
I really like a well constructed infographic. I would probably willingly learn about anything from a cool infographic. There is a real approach you need to take when creating an infographic. Infographic Journal has collected over 5,000 of some of the coolest – just for the joy of browsing. I find that viewing all the creative representations gets me in the mood to create myself! Of course when you create a cool one yourself you can submit it them, also elearning feeds, mostly it just makes you an edurock star in my opinion. It is obvious I am invested in the idea of representing information through an infographic, but how do you know when it is right to represent an idea this way?
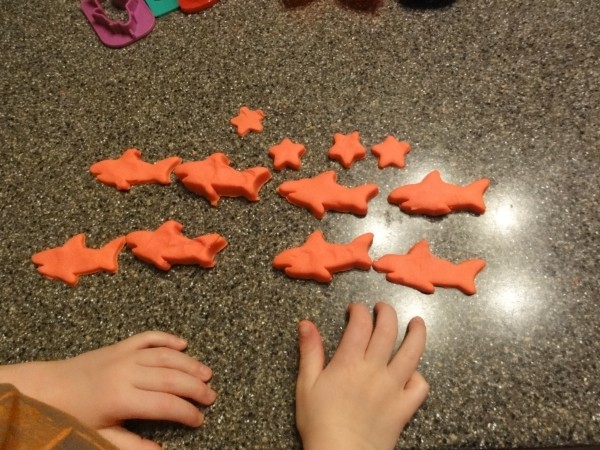
And you can quote scientific studies about the quicker “learning” that the eye does than through reading text, but that is not quite as impressive as experiencing it for yourself. When you see an idea before you read the idea itself is when you will understand all you need to know about infographics. You could ask my two kiddos, playing Play Dough one night that made “graphs” for me:
 |
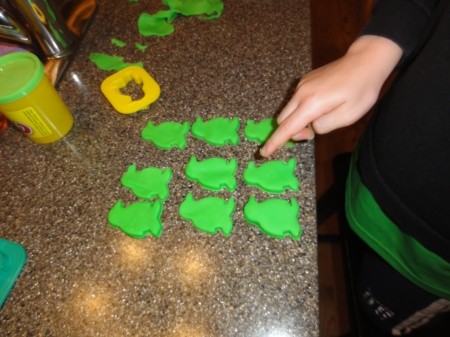 |
| My 3 year old said, “Sharks like stars.” | My seven year old said, “Nine out of nine penguins agree.”
Me: “Agree with what?” 7YO: “Each other!” |
My attempts at infographics have been limited, but I share them in Do You Want to Build an Infographic? I also share a Visual.ly’s Twitterize Yourself.
The most recent work product is through Venngage and I haven’t decide if I like it and/or the platform yet:
But what I have discovered is that sometimes the organization and creation of the infographic might not be worth it. After looking at the above, what do you think about the existing table:
 After the benefit of some reflection, I do not think it is a better use of time (mine or the reader’s) to try to represent this as an infographic. Now part of my decision making needs to be if it is worth the time to
Yesterday a colleague who was interested in making infographics a few years back shared an infographic she purchased on Fiverr.com – c’mon man. We can do better! But I guess she went thought he same process I needed to go through – evaluate if it was worth time to create it herself.
That tells me either building the skill set to create an infographic is prohibitive or the selection of potential (free) tools might be off-putting somehow. I would like to see this thought-intensive process incorporated into classrooms as a way to think through fidelity of data, how to share ideas, and of course design. It seems like a perfect summative activity for an integrated unit of study.
What do you think?
Are you using infographics – consuming or producing?
Have you reached the point of it not being worth your effort to produce an infographic?


Leave a Reply